Monitoring: Difference between revisions
m (1 revision imported) |
pc>Yuron No edit summary |
||
| Line 1: | Line 1: | ||
{{#set: Priority=1 | Summary=Watching what is going on.}}<!-- | {{#set: Priority=1 | Summary=Watching what is going on.}}<!-- | ||
-->{{#invoke:Dependencies|add|Resources,3}} | -->{{#invoke:Dependencies|add|Resources,3}} | ||
“[https://en.wikipedia.org/wiki/Monitor Monitor]” is used for numerous things in | “[https://en.wikipedia.org/wiki/Monitor Monitor]” is used for numerous things in computing. This article gives a brief outline of the sort of data an operating system might record and hints at some tools which can be useful in seeing what is going on; this is probably called a “system monitor” | ||
computing. This article gives a brief outline of the sort of data an | |||
operating system might record and hints at some tools which can be | |||
useful in seeing what is going on; this is probably called a | |||
“system monitor” | |||
[[Image:sys_mon.png|link=|alt=System monitor]] | [[Image:sys_mon.png|link=|alt=System monitor]] | ||
The example above shows a graphical trace of some of the more | The example above shows a graphical trace of some of the more significant system information over time. The useful activity of each of the (in this case) four processor ‘cores’ is shown, as is the amount of physical [[Memory|RAM]] and swap space and the | ||
significant system information over time. The useful activity of each | |||
of the (in this case) four processor ‘cores’ is shown, as | |||
is the amount of physical [[Memory|RAM]] and swap space and the | |||
communications activity. | communications activity. | ||
Such graphical tools are useful at giving an overview: there are other | Such graphical tools are useful at giving an overview: there are other tools which give more specific information. Here are some typical Unix utilities: | ||
tools which give more specific information. Here are some typical | |||
Unix utilities: | |||
*<code>top</code> and <code>htop</code> – list processes in order of how much CPU time each has used recently. (Try these on a server too.) | *<code>top</code> and <code>htop</code> – list processes in order of how much CPU time each has used recently. (Try these on a server too.) | ||
| Line 25: | Line 16: | ||
*<code>lsof</code> – list open files; you may want to filter this a bit! | *<code>lsof</code> – list open files; you may want to filter this a bit! | ||
There is also lots of system information – disguised as files – in | There is also lots of system information – disguised as files – in the <code>/proc/...</code> subtree. | ||
the <code>/proc/...</code> subtree. | |||
=== Here are some other suggestions for tools: === | === Here are some other suggestions for tools: === | ||
| Line 36: | Line 26: | ||
---- | ---- | ||
{{BookChapter|2.10.2|96-97}} | |||
{{PageGraph}} | {{PageGraph}} | ||
{{Category|User}} | {{Category|User}} | ||
Revision as of 15:13, 2 August 2019
| Depends on | Resources |
|---|
“Monitor” is used for numerous things in computing. This article gives a brief outline of the sort of data an operating system might record and hints at some tools which can be useful in seeing what is going on; this is probably called a “system monitor”
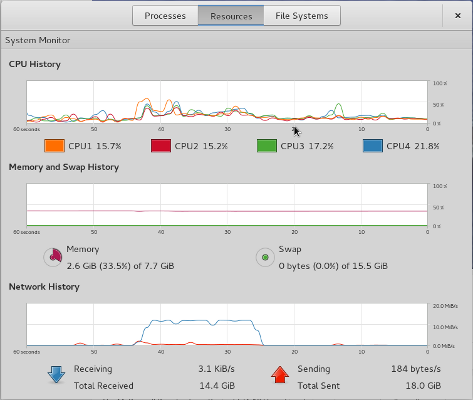
The example above shows a graphical trace of some of the more significant system information over time. The useful activity of each of the (in this case) four processor ‘cores’ is shown, as is the amount of physical RAM and swap space and the communications activity.
Such graphical tools are useful at giving an overview: there are other tools which give more specific information. Here are some typical Unix utilities:
topandhtop– list processes in order of how much CPU time each has used recently. (Try these on a server too.)pstree– show the relationship of processesvmstat– virtual memory statisticsiostat– CPU/IO statisticslsof– list open files; you may want to filter this a bit!
There is also lots of system information – disguised as files – in the /proc/... subtree.
Here are some other suggestions for tools:
- opensource.com
- upbuntu.com
- tecmint
- New suggestions welcome!
| Also refer to: | Operating System Concepts, 10th Edition: Chapter 2.10.2, pages 96-97 |
|---|